Promoting respect and sensitivity for others to enhance the quality of life for all.
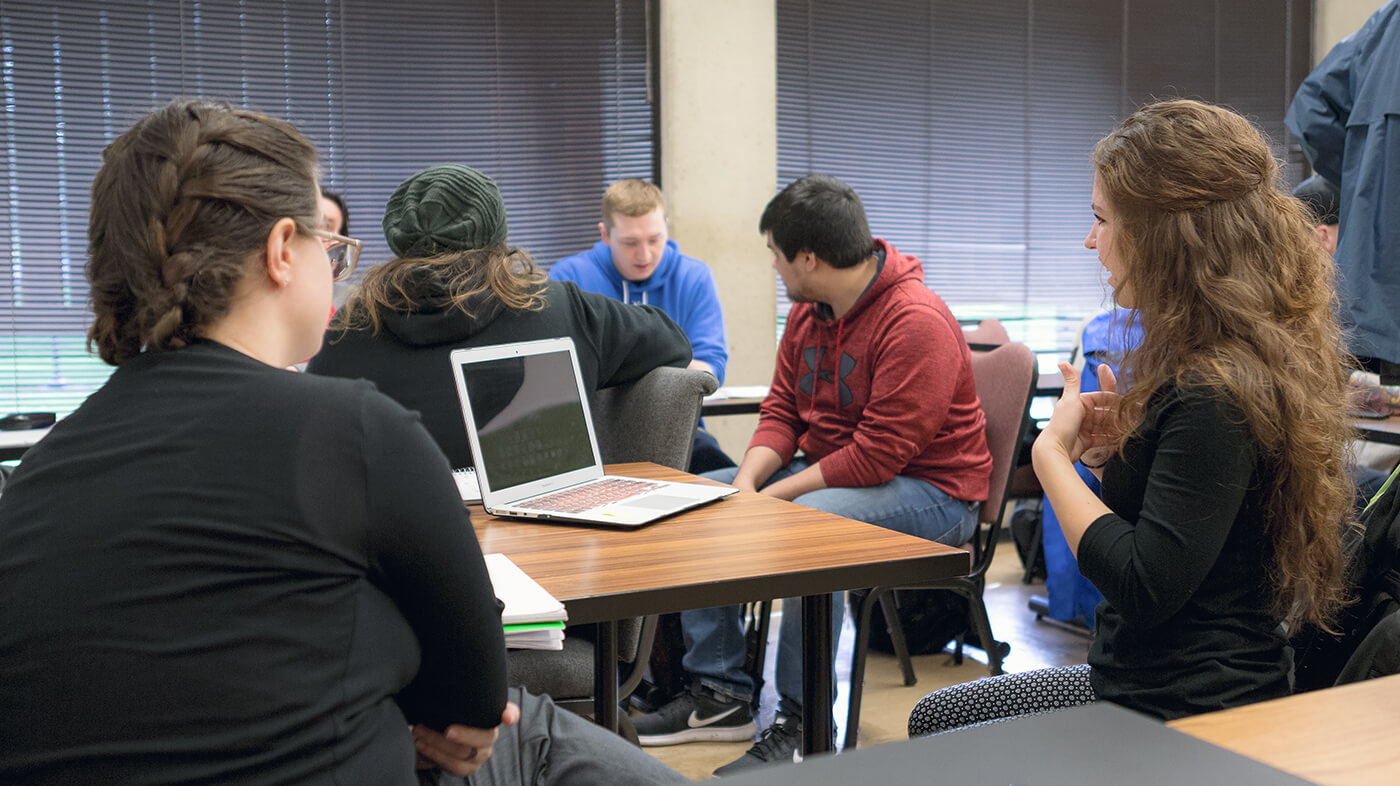
The Division of Deaf Studies & Professional Studies prepares professionals to provide unique communication, rehabilitation, and educational services to individuals with disabilities or special needs.
Programs & Degrees
Stories from Deaf Studies & Professional Studies
Who We Are
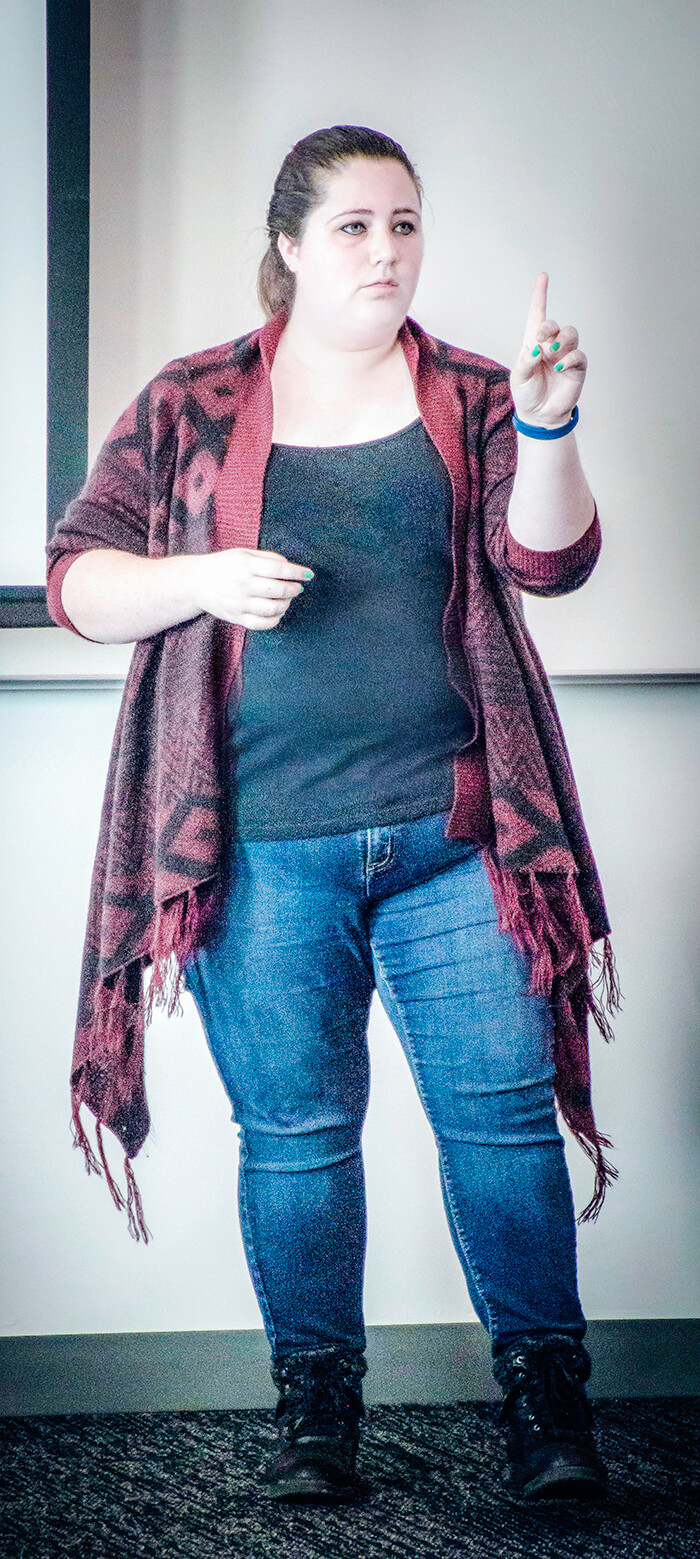
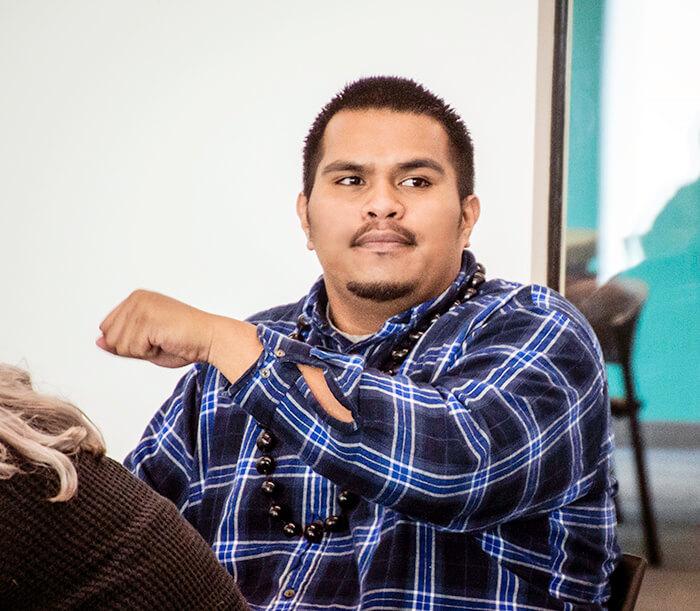
Our Students


Contact Us
Division of Deaf Studies & Professional Studies Main Office
Location:
139 Richard Woodcock Education Center (RWEC)
345 Monmouth Ave N.
Hours:
Monday – Thursday
8:00 a.m. – 5:00 p.m.
Kathy Heide
Administrative Program Assistant
Phone: (503) 838-8322
Email: heidek@wou.edu